Build the product
Specify the CDS portfolio, leverage limits, funding terms and cash-in and cash-out conditions.
A simulation of a composite Constant Proportion Debt Obligation referencing Siemens, Allianz and LVMH five-year CDS. The framework combines empirical regime calibration, jump diffusion and dynamic leverage.
The baseline default probability is 0.33%, consistent with a BBB estimate under the project’s internal rating map. When spread widening, volatility, jump intensity and crisis persistence occur together, default probability rises to 17.33% and the indicative rating falls to CCC.
The model treats the product as a bank-structured credit vehicle. It defines the reference portfolio, cash flows, leverage rule, capital barriers and rating logic, then tests the structure against simulated CDS paths.
Specify the CDS portfolio, leverage limits, funding terms and cash-in and cash-out conditions.
Estimate credit-spread dynamics from observed normal and crisis periods.
Simulate capital paths and map barrier breaches to an indicative rating.
Assess how the rating changes when several adverse drivers occur at the same time.
The calibration combines Siemens, Allianz and LVMH CDS data from 2001–2010 and 2020–2025. A day enters the crisis regime when either the spread level or 21-day realised volatility exceeds its rolling 252-day 90th percentile. The classification is lagged one day to avoid look-ahead bias.
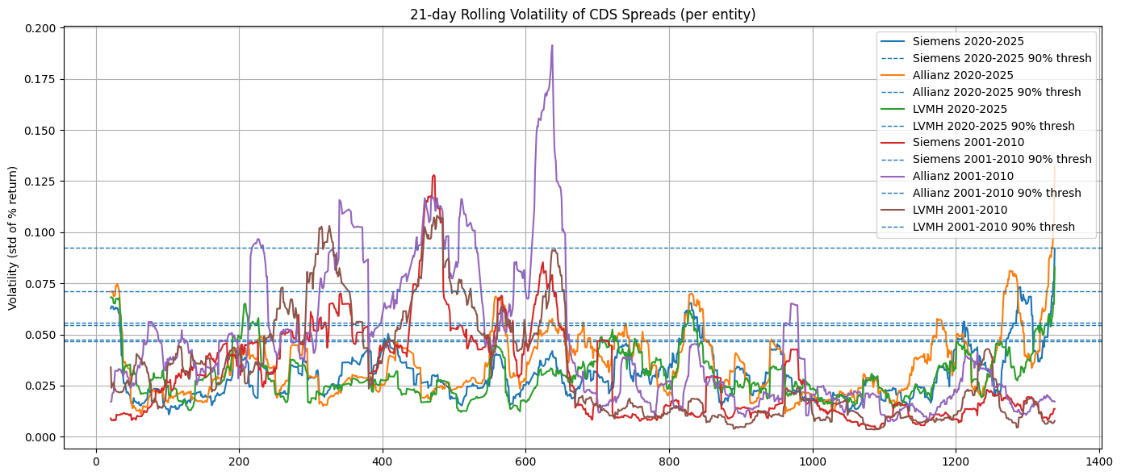
Regime-specific Ornstein–Uhlenbeck parameters capture mean reversion. A hybrid jump filter identifies extreme returns, while Gaussian mixture models estimate jump size and frequency. An empirical Markov matrix governs movement between normal and crisis states.
| From / to | Normal | Crisis |
|---|---|---|
| Normal | 95.00% | 5.00% |
| Crisis | 10.96% | 89.04% |
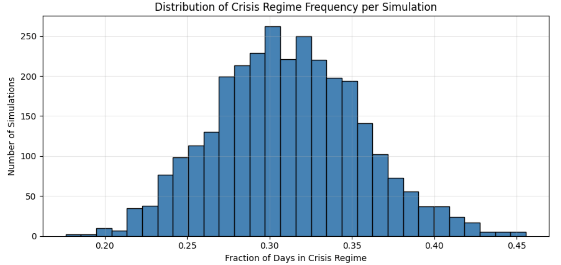
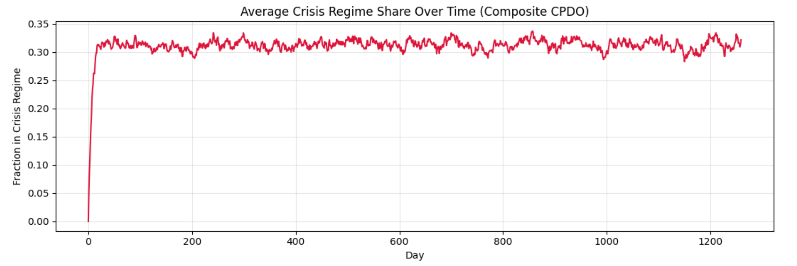
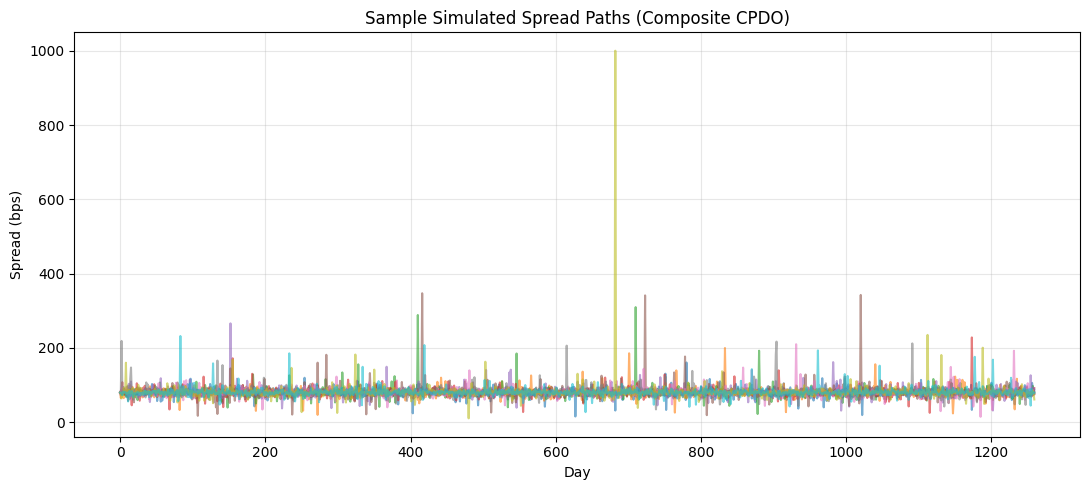
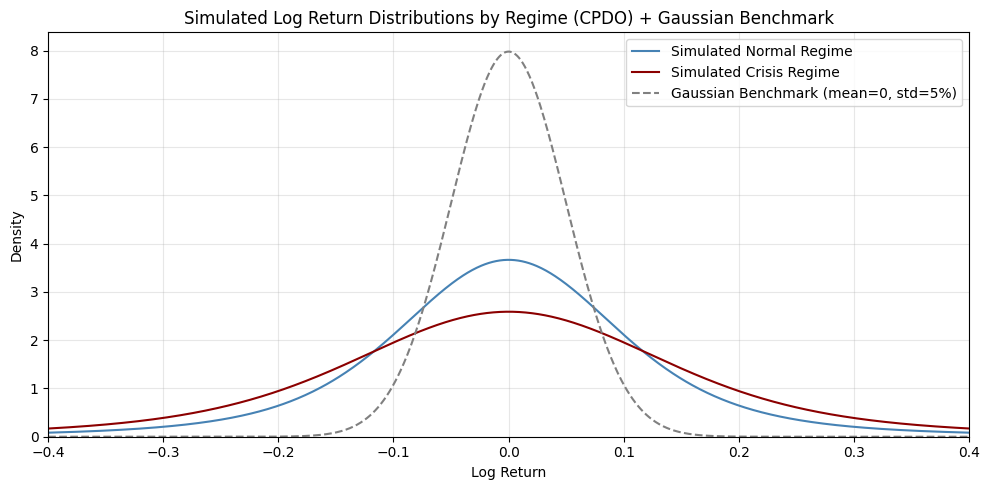
The framework separates spread generation from product mechanics. Regime and jump parameters produce CDS paths. Those paths then drive leverage, carry, mark-to-market losses, funding cost and barrier events.
ΔXₜ = θᵣ(μᵣ − Xₜ)Δt + σᵣ√Δt·εₜ + JₜOU parameters vary between normal and crisis regimes. The jump term uses regime-specific frequency and size estimates.
L*ₜ = sₜ / (γᵣ · σ²ₜ)Higher spreads increase target exposure. Higher variance or a larger regime-specific gamma reduces it. Leverage remains between 0× and 25×.
MtMₜ = −0.5 · Dₜ · Δsₜ · Lₜ · Cₜ₋₁Spread widening reduces capital. Effective duration increases with the spread level but stays within the configured floor and cap.
Cₜ = Cₜ₋₁ + carry + MtM + yield − funding − costsThe path terminates at the cash-in target, the capital floor or five-year maturity.
The vehicle sells CDS protection to earn carry. When spreads move or volatility changes, the model recalculates target leverage. The daily capital account includes carry, mark-to-market impact, funding cost, capital yield and transaction cost.
| Parameter | Setting | Purpose |
|---|---|---|
| Initial leverage | 7× | Starting CDS exposure |
| Maximum leverage | 25× | Upper exposure constraint |
| Cash-in target | 110 | Successful early termination |
| Capital floor | 50 | Default trigger |
| Barrier trigger | 55 | 20% leverage reduction near the floor |
| Coupon rate | 6.0% | Funding outflow |
| Capital yield | 3.0% | Return on the cash account |
| Transaction cost | 3 bps | Cost of leverage changes |
| Rebalancing band | 20% | Limits unnecessary turnover |
Each scenario changes one or more calibrated inputs and reruns the spread and capital simulation. The combined case applies broader spread widening, higher volatility, greater jump intensity and more persistent crisis dynamics.
| Scenario | Probability of default | Capital breaches | Cash-in events | Indicative rating |
|---|---|---|---|---|
| Baseline | 0.33% | 1 | 0 | BBB |
| Spread widening | 8.33% | 25 | 6 | B |
| High volatility | 0.67% | 2 | 0 | BBB |
| Higher jump risk | 0.00% | 0 | 0 | AAA |
| Greater crisis persistence | 0.33% | 1 | 0 | BBB |
| Combined stress | 17.33% | 52 | 16 | CCC |
Isolated jump risk has little effect in this run. Losses become nonlinear when wider spreads, volatility and persistent crisis conditions interact with the leverage rule.
Pre-crisis rating methods relied heavily on mean reversion, low correlations and calm calibration periods. The project framework introduces explicit crisis regimes and empirical jumps, then tests several risk drivers together.
| Model dimension | Moody’s pre-crisis approach | S&P pre-crisis approach | Project framework |
|---|---|---|---|
| Spread process | Mean-reverting CEV process with capped volatility | Mean reversion with low spread volatility | Regime-switching OU process in log space |
| Tail events | No explicit discrete jump process | Extreme spread moves materially understated | Hybrid jump detection, Gaussian mixtures and Student-t diffusion |
| Dependence | One-factor Gaussian copula with low fixed correlation | Low correlation within a separate default model | Empirical jump correlation and common regime transitions |
| Calibration | Primarily calm 2003–2006 investment-grade data | Historical inputs with benign volatility assumptions | Three CDS names across 2001–2010 and 2020–2025 |
| Leverage mechanics | Trading rule and NAV simulated within the rating model | CPDO NAV and cash-out probability simulated | Variance-sensitive leverage with cap, barrier de-risking and transaction costs |
| Rating measure | Expected loss compared with an Aaa threshold | Cash-out probability compared with rating thresholds | Simulated capital-floor breach rate mapped to indicative rating bands |
Most regime-level ADF tests do not reject a unit root at the 5% level. This weakens the empirical support for a stationary OU specification.
Crisis gamma estimates differ sharply between the two historical windows. The weighted estimate reduces that instability but does not eliminate it.
Rare-event ratings require larger path counts, fixed seeds and confidence intervals. A small number of barrier breaches creates wide sampling uncertainty.
The framework needs out-of-sample spread and capital-path tests, together with benchmark comparisons against simpler specifications.
Average jump correlation cannot fully represent state-dependent contagion or joint spread-default dynamics during a systemic event.
Scenario inputs should remain immutable across runs, with independent validation of leverage, barrier and rating logic.
The historical CPDO experience shows how mean reversion, correlation and leverage assumptions can suppress estimated tail risk. A credible rating framework must allow adverse market drivers to reinforce one another.
Fast reversion pulls spreads back too quickly and understates prolonged credit deterioration.
Low fixed correlations miss the rise in systemic co-movement during market stress.
Gaussian spread changes and volatility caps reduce the frequency and severity of extreme outcomes.
Increasing exposure after losses can turn a temporary spread shock into a capital breach.
Separate spread and default models fail to capture the dependence that emerges in a crisis.
Independent code review, fixed seeds and transparent scenarios are necessary before assigning a rating.
The repository contains the regime classification, OU calibration, jump estimation, spread simulation, CPDO capital engine and stress tests. Review the model →